Several weeks ago I wrote about using screenshots for rough maps. This past week I’ve been doing just that for a project. This particular project isn’t about making beautiful maps – it was mostly about building a database of onsite septic systems to be honest with you – though I try not to mention that in everyday conversation. In addition to the data creation effort part of the project there was also a data gathering portion and a data analysis portion.
Now, with most GIS projects it seems that 50% of the effort is on the data and 50% is on the analysis of the data. There’s the time it takes to ask for and receive data, create data, pre-prep data, and learn about the data that should always be figured in to any GIS effort or it will go over time and over budget. The septic system project is one that actually consisted of 90% data prep work and only about 10% analysis work.
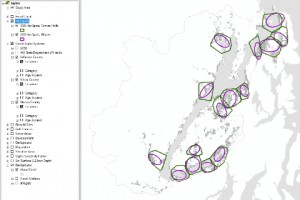
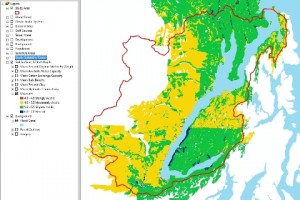
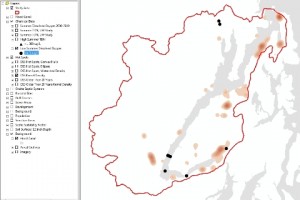
Now that it is time to transfer data and results to the client I need a quick and easy way to give the clients an overview of the vast amount of data collected and created and a few of the analytical results as well. The easiest way was with screenshots. It simply would have taken too long to create an automated map book that looked at all decent. Since I already had a master project file with all the data displayed nicely for web-casting to the clients and stakeholders, I simply selected certain layers, took screenshots, selected other layers, took screenshots, and repeat. They will also get the whole data package, layer files, and project files, but this makes me know for certain that they will see the items that I want to highlight in the correct symbology. If the client so wishes, these maps can be finalized into higher resolution maps with real legends and such. There are 42 maps, all of the same geographic area. Here are a few:


Recent Comments