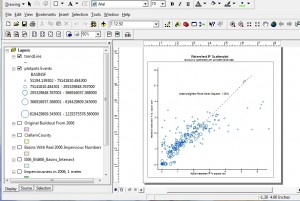
This isn’t your typical mapping task, but I am currently evaluating the effectiveness of a model that uses 1-meter impervious surface data and I needed a scatterplot. Did you know that you can actually make one in ArcGIS? It’s definitely a creative use of the software as it really isn’t a function that you just choose from a drop-down menu. What you are doing is essentially plotting your data points in x,y space.
I had a dataset of basins (aka watersheds) that had a measured imperviousness percentage based on the 1-meter impervious data – basically just an intersect between the two datasets and a summary procedure. Note you could easily do a raster zonal analysis instead, but my data were already in vector. I also had data on the percent impervious of the basins based on a model. In an ideal world the two would match. In other words, y=x.
So I had two variables: the actual impervious and the modeled impervious. Add to that a third variable: size of basin, and that’s all that needs to be on the scatterplot. I figured size of basin is important because it would make sense that larger basins would have less error than smaller basins. So I outputed those three variables into a table and then imported the table as an x,y dataset where x was the actual and y was the modeled.
I guess I should mention that I took the square root of the percentages first, before plotting them on the graph. This preserves the relationships that I’m measuring while reining in the values, so to speak. Then I symbolized by graduated symbols. These were hollow circles to help visualize overlap. I created an y=x line too, then fitted the graph axes where they should go.
Overall I’m quite pleased, both with the visualization and the results. The results show that the data do get pretty close to the y=x line for the most part. There’s quite a bit of scatter in both directions with the very small basins. However, these basins are very small. I think it is safe to say the model does not predict imperviousness in very small basins well.
I may did write an entry tomorrow on calculating the area-weighted root mean square error. That is sure to be extra-exciting! 


Recent Comments